Learn How to Read
Open Interest (OI) Data
& Trade Nifty with Confidence
Join Mr. Rohit Saraf's FREE live session — discover how to decode OI data, spot key market levels, and find high-probability setups in Nifty.
OI Data Is Powerful — But Confusing Without the Right Education
Most traders ignore Open Interest entirely because it feels complex. That costs them valuable market insights.
No Idea What OI Means
You see the OI column in the option chain but have no clue what it's telling you — or how to use it in your trading decisions.
Missing Key Market Signals
Without reading OI, you're trading blind. Critical signals about support, resistance, and breakouts remain invisible to you.
Overwhelmed by Option Chain
The option chain shows dozens of numbers — CE, PE, OI, Change in OI — and it's overwhelming without a structured approach to reading them.
OI Data: Your Market Intelligence Tool
Open Interest tells you where institutional money is positioned. Learn to read it and you'll see what most traders can't.
-
✓Decode the Option Chain
Learn to read CE and PE open interest data to understand market sentiment and direction.
-
✓Spot Support & Resistance Levels
OI concentration at strikes reveals strong support and resistance levels that price respects.
-
✓Identify Intraday Trends Early
Use Change in OI data to detect trend shifts before they appear on price charts.
-
✓Trade Breakouts with Confirmation
OI signals confirm whether a breakout is real or a fakeout — dramatically improving your entries.
Where Can You Apply OI Analysis?
This skill is primarily built for Indian equity derivatives — the most liquid markets where OI data is most powerful.
Nifty 50
Index options & futures intraday
Bank Nifty
High OI activity for intraday setups
Stock F&O
Individual stock derivatives
What You'll Learn in This Session
Master these essential skills to become a more confident and informed trader using OI data.
Option Chain Analysis
Learn to interpret option chain data — CE vs PE open interest — for making more informed trading decisions.
Important OI Data Signals
Identify crucial market signals through Open Interest analysis — what rising OI means in different price contexts.
OI vs Change: Finding Trends
Master intraday trend identification using OI data patterns — understand how change in OI reveals trend strength.
Support & Resistance via OI
Discover key price levels using Open Interest data — where institutions are writing options tells you where price will pause.
Breakout Trading Strategies
Learn to spot and trade breakouts using OI confirmation so you enter only the high-probability moves.
Putting It All Together
Combine all OI signals into a simple, repeatable framework for your daily Nifty trading analysis routine.
Meet Mr. Rohit Saraf
Learn directly from an educator with 12+ years of stock market experience.

With 12+ years of stock market experience and 15+ years as a Life & Business Coach, Rohit has educated over 20,000 students across India in chart reading, options analysis, and structured trading strategies. His teaching style simplifies complex derivative concepts into clear, practical learning.
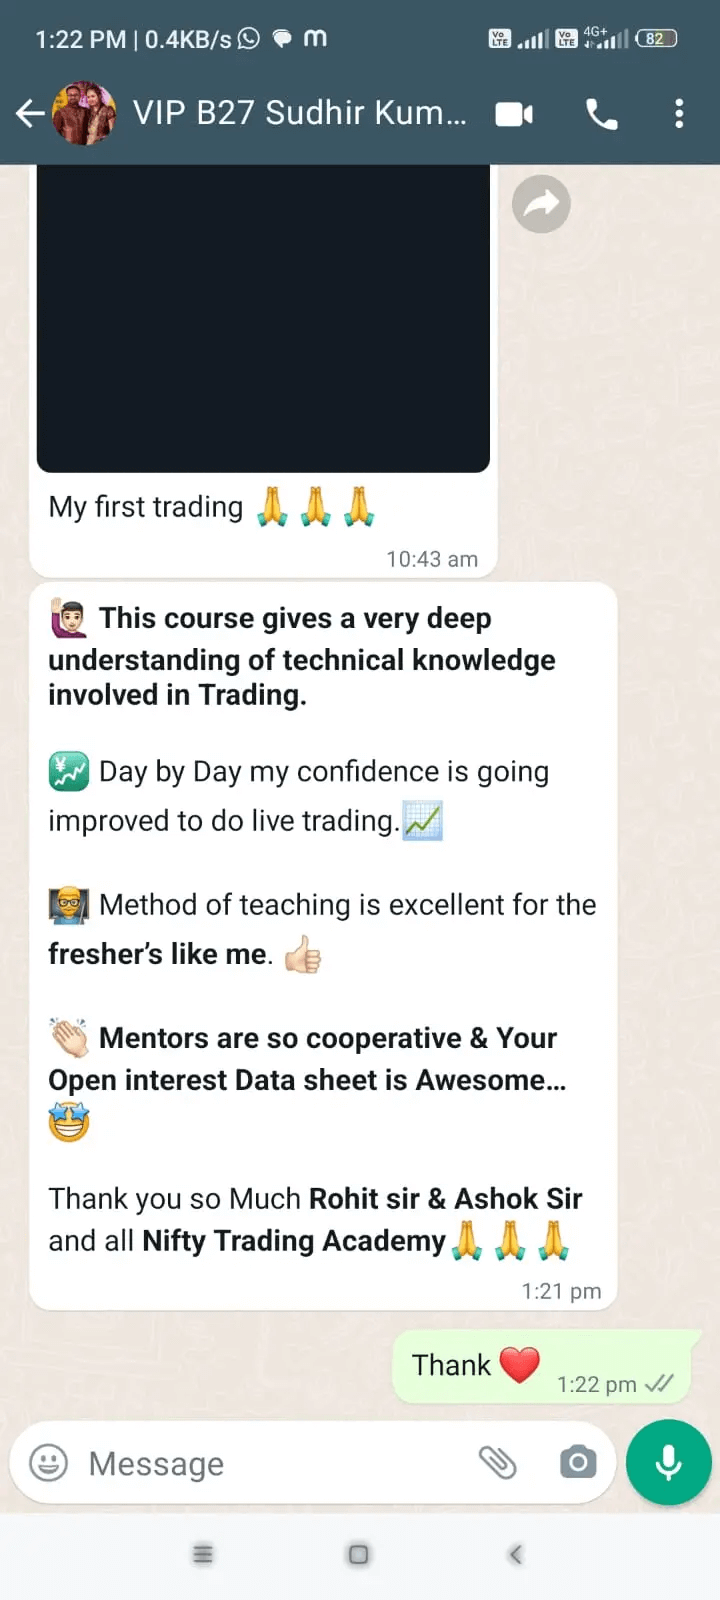
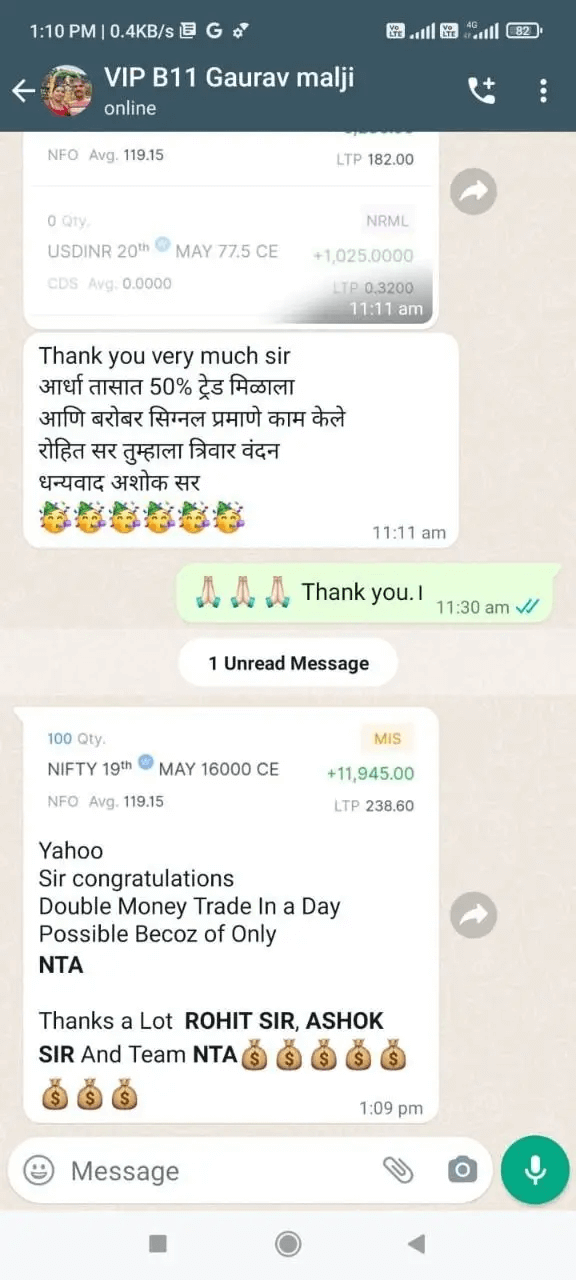
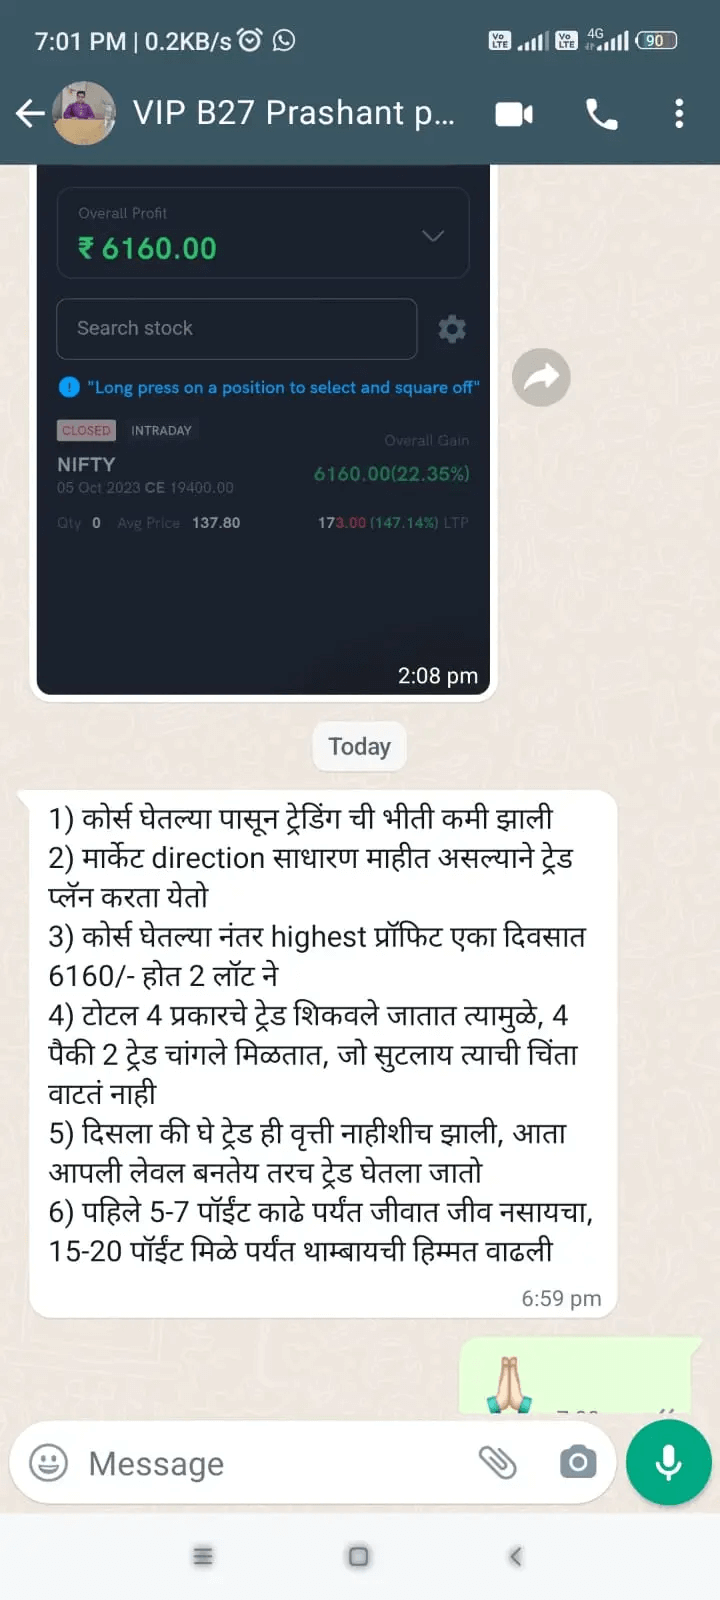
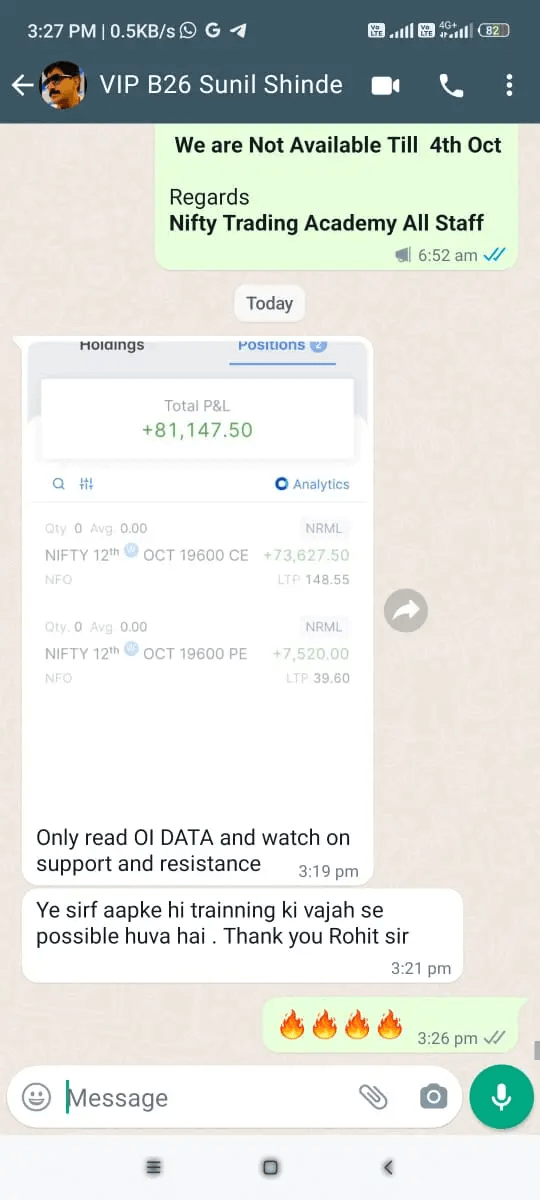
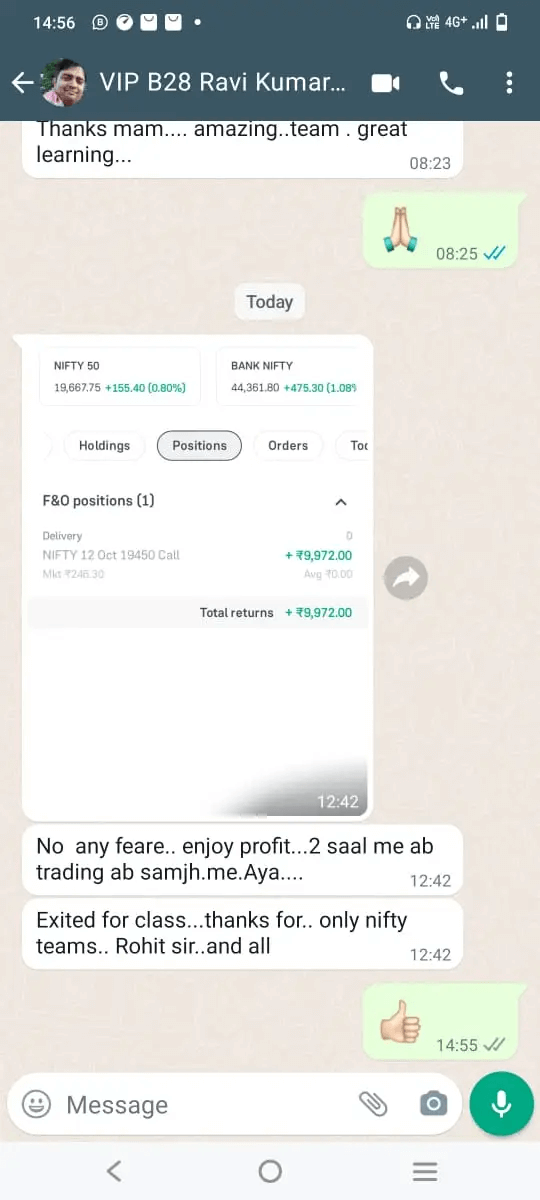
What Our Students Say
Real responses from learners who attended previous educational webinars by Zoomb Education.
This Webinar Is Perfect For You If...
Whether you're new to derivatives or already trade Nifty, this session adds a powerful tool to your analysis.
Nifty Traders
Learn how OI data improves your existing Nifty intraday & positional decisions.
Options Learners
Understand what's really happening beneath the surface of the options market.
F&O Students
OI is the single most valuable tool for anyone studying futures & options.
Beginners Welcome
We explain every concept from scratch — no prior knowledge of OI needed.
Frequently Asked Questions
Ready to Finally Understand OI Data and Trade Smarter?
This 2-hour live educational session teaches you how to read Open Interest data for Nifty — completely free. Don't miss it.
Join live for the best experience — we recommend attending with your trading group.
⚠️ Educational Only • Not SEBI Registered • No Stock Tips • No Investment Advice
Join the FREE
OI Data Webinar
Learn how to read Open Interest data for Nifty — live, interactive, and completely free.
Loading...
- ✓ Read the option chain like a pro
- ✓ Spot support & resistance via OI
- ✓ Identify intraday trends early
- ✓ Confirm breakouts using OI data
By registering you agree to receive updates about this educational webinar. We respect your privacy.